|
GPUE
v1.0
GPU Gross-Pitaevskii Equation numerical solver for Bose-Einstein condensates
|
|
GPUE
v1.0
GPU Gross-Pitaevskii Equation numerical solver for Bose-Einstein condensates
|
Functions | |
| def | kinertrum (Psi, dx, i, quOn) |
| Kinetic energy spectrum = kinertrum. More... | |
| def | kinertrum_loop (dataName, initValue, finalValue, incr) |
| def | dens_struct_fact (dataName, initValue, finalValue, incr) |
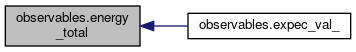
| def | energy_total (dataName, initValue, finalValue, increment) |
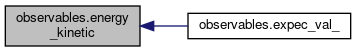
| def | energy_kinetic (dataName, initValue, finalValue, increment) |
| def | energy_potential (dataName, initValue, finalValue, increment) |
| def | ang_mom (dataName, initValue, finalValue, incr, ev_type, imgdpi) |
| def | expec_val_monopole (dataName, initValue, finalValue, incr) |
| def | expec_val_quadrupole (dataName, initValue, finalValue, incr) |
| def | expec_val_ (quant_name, quantity, dataName, initValue, finalValue, incr) |
Variables | |
| float | HBAR = 1.05457148e-34 |
| float | PI = 3.141592653589793 |
| prec | |
| c = ConfigParser.ConfigParser() | |
| xDim = int(c.getfloat('Params','xDim')) | |
| yDim = int(c.getfloat('Params','yDim')) | |
| gndMaxVal = int(c.getfloat('Params','gsteps')) | |
| evMaxVal = int(c.getfloat('Params','esteps')) | |
| incr = int(c.getfloat('Params','print_out')) | |
| tuple | dx = (c.getfloat('Params','dx')) |
| tuple | dy = (c.getfloat('Params','dy')) |
| tuple | dkx = (c.getfloat('Params','dpx')) |
| tuple | dky = (c.getfloat('Params','dpy')) |
| tuple | dt = (c.getfloat('Params','dt')) |
| tuple | xMax = (c.getfloat('Params','xMax')) |
| tuple | yMax = (c.getfloat('Params','yMax')) |
| tuple | omegaZ = (c.getfloat('Params','omegaZ')) |
| tuple | mass = (c.getfloat('Params','Mass')) |
| tuple | omega = (c.getfloat('Params','omega')) |
| tuple | omegaX = (c.getfloat('Params','omegaX')) |
| num_vort = int(c.getfloat('Params','Num_vort')) | |
| N = int(c.getfloat('Params','atoms')) | |
| data = numpy.ndarray(shape=(xDim,yDim)) | |
| x = np.asarray(open('x_0').read().splitlines(),dtype='f8') | |
| y = np.asarray(open('y_0').read().splitlines(),dtype='f8') | |
| kx = np.reshape( np.array( [np.linspace( 0, (xDim/2-1)*dkx, xDim/2), np.linspace( (-xDim/2-1)*dkx, -dkx, xDim/2)]), (xDim,1) ) | |
| ky = np.reshape( np.array( [np.linspace( 0, (yDim/2-1)*dky, yDim/2), np.linspace( (-yDim/2-1)*dky, -dky, yDim/2)]), (yDim,1) ) | |
| kxm | |
| kym | |
| km_mag = np.sqrt( kxm**2 + kym**2 ) | |
| k_mag = np.sqrt( kx**2 + ky**2 ) | |
| kMax = max(max(k_mag)) | |
| float | hbar = 1.05457e-34 |
| float | m = 1.4431607e-25 |
| V = np.array(open('V_0').read().splitlines(),dtype='f8') | |
| K = np.array(open('K_0').read().splitlines(),dtype='f8') | |
| xPy = np.array(open('xPy_0').read().splitlines(),dtype='f8') | |
| yPx = np.array(open('yPx_0').read().splitlines(),dtype='f8') | |
| tuple | g = (0.5*N)*4.0*HBAR*HBAR*PI*(4.67e-9/mass)*np.sqrt(mass*omegaZ/(2.0*PI*HBAR)) |
observables.py - GPUE: Split Operator based GPU solver for Nonlinear
Schrodinger Equation, Copyright (C) 2011-2015, Lee J. O'Riordan
<loriordan@gmail.com>, Tadhg Morgan, Neil Crowley. All rights reserved.

Redistribution and use in source and binary forms, with or without
modification, are permitted provided that the following conditions are
met:

1. Redistributions of source code must retain the above copyright
notice, this list of conditions and the following disclaimer.

2. Redistributions in binary form must reproduce the above copyright
notice, this list of conditions and the following disclaimer in the
documentation and/or other materials provided with the distribution.

3. Neither the name of the copyright holder nor the names of its
contributors may be used to endorse or promote products derived from
this software without specific prior written permission.

THIS SOFTWARE IS PROVIDED BY THE COPYRIGHT HOLDERS AND CONTRIBUTORS
"AS IS" AND ANY EXPRESS OR IMPLIED WARRANTIES, INCLUDING, BUT NOT
LIMITED TO, THE IMPLIED WARRANTIES OF MERCHANTABILITY AND FITNESS FOR A
PARTICULAR PURPOSE ARE DISCLAIMED. IN NO EVENT SHALL THE COPYRIGHT
HOLDER OR CONTRIBUTORS BE LIABLE FOR ANY DIRECT, INDIRECT, INCIDENTAL,
SPECIAL, EXEMPLARY, OR CONSEQUENTIAL DAMAGES (INCLUDING, BUT NOT LIMITED
TO, PROCUREMENT OF SUBSTITUTE GOODS OR SERVICES; LOSS OF USE, DATA, OR
PROFITS; OR BUSINESS INTERRUPTION) HOWEVER CAUSED AND ON ANY THEORY OF
LIABILITY, WHETHER IN CONTRACT, STRICT LIABILITY, OR TORT (INCLUDING
NEGLIGENCE OR OTHERWISE) ARISING IN ANY WAY OUT OF THE USE OF THIS
SOFTWARE, EVEN IF ADVISED OF THE POSSIBILITY OF SUCH DAMAGE.
| def observables.ang_mom | ( | dataName, | |
| initValue, | |||
| finalValue, | |||
| incr, | |||
| ev_type, | |||
| imgdpi | |||
| ) |
Definition at line 293 of file observables.py.
Referenced by expec_val_().

| def observables.dens_struct_fact | ( | dataName, | |
| initValue, | |||
| finalValue, | |||
| incr | |||
| ) |
Definition at line 194 of file observables.py.
References kinertrum().
Referenced by expec_val_().


| def observables.energy_kinetic | ( | dataName, | |
| initValue, | |||
| finalValue, | |||
| increment | |||
| ) |
Definition at line 268 of file observables.py.
Referenced by expec_val_().
| def observables.energy_potential | ( | dataName, | |
| initValue, | |||
| finalValue, | |||
| increment | |||
| ) |
Definition at line 290 of file observables.py.
| def observables.energy_total | ( | dataName, | |
| initValue, | |||
| finalValue, | |||
| increment | |||
| ) |
Definition at line 235 of file observables.py.
Referenced by expec_val_().
| def observables.expec_val_ | ( | quant_name, | |
| quantity, | |||
| dataName, | |||
| initValue, | |||
| finalValue, | |||
| incr | |||
| ) |
Definition at line 382 of file observables.py.
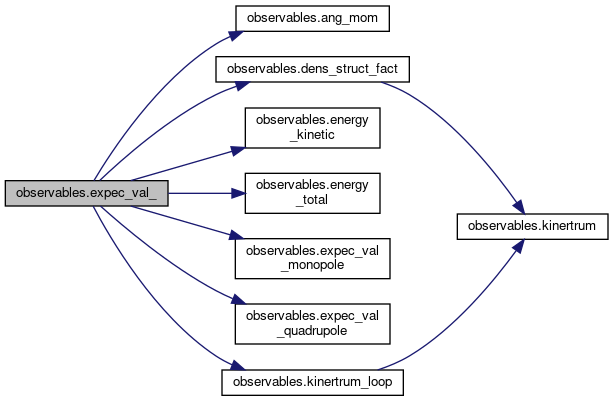
References ang_mom(), dens_struct_fact(), energy_kinetic(), energy_total(), expec_val_monopole(), expec_val_quadrupole(), and kinertrum_loop().
| def observables.expec_val_monopole | ( | dataName, | |
| initValue, | |||
| finalValue, | |||
| incr | |||
| ) |
Definition at line 330 of file observables.py.
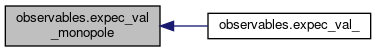
Referenced by expec_val_().
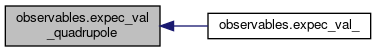
| def observables.expec_val_quadrupole | ( | dataName, | |
| initValue, | |||
| finalValue, | |||
| incr | |||
| ) |
Definition at line 356 of file observables.py.
Referenced by expec_val_().
| def observables.kinertrum | ( | Psi, | |
| dx, | |||
| i, | |||
| quOn | |||
| ) |
Kinetic energy spectrum = kinertrum.
Calculates the spectrum for compressible and incompressible kinetic energies.
| Psi | The wavefunction |
| dx | Increment along x |
| i | The current step number |
| quOn | Boolean to turn on quantum kinetic energy spectrum (includes phase term). |
Definition at line 104 of file observables.py.
Referenced by dens_struct_fact(), and kinertrum_loop().
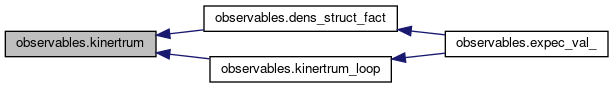
| def observables.kinertrum_loop | ( | dataName, | |
| initValue, | |||
| finalValue, | |||
| incr | |||
| ) |
Definition at line 183 of file observables.py.
References kinertrum().
Referenced by expec_val_().


| observables.c = ConfigParser.ConfigParser() |
Definition at line 55 of file observables.py.
Definition at line 82 of file observables.py.
| tuple observables.dkx = (c.getfloat('Params','dpx')) |
Definition at line 66 of file observables.py.
| tuple observables.dky = (c.getfloat('Params','dpy')) |
Definition at line 67 of file observables.py.
| tuple observables.dt = (c.getfloat('Params','dt')) |
Definition at line 68 of file observables.py.
| tuple observables.dx = (c.getfloat('Params','dx')) |
Definition at line 64 of file observables.py.
| tuple observables.dy = (c.getfloat('Params','dy')) |
Definition at line 65 of file observables.py.
| observables.evMaxVal = int(c.getfloat('Params','esteps')) |
Definition at line 61 of file observables.py.
Definition at line 233 of file observables.py.
| observables.gndMaxVal = int(c.getfloat('Params','gsteps')) |
Definition at line 60 of file observables.py.
| float observables.HBAR = 1.05457148e-34 |
Definition at line 51 of file observables.py.
| float observables.hbar = 1.05457e-34 |
Definition at line 96 of file observables.py.
| observables.incr = int(c.getfloat('Params','print_out')) |
Definition at line 62 of file observables.py.
| observables.K = np.array(open('K_0').read().splitlines(),dtype='f8') |
Definition at line 227 of file observables.py.
Definition at line 93 of file observables.py.
Definition at line 92 of file observables.py.
| observables.kMax = max(max(k_mag)) |
Definition at line 94 of file observables.py.
| observables.kx = np.reshape( np.array( [np.linspace( 0, (xDim/2-1)*dkx, xDim/2), np.linspace( (-xDim/2-1)*dkx, -dkx, xDim/2)]), (xDim,1) ) |
Definition at line 89 of file observables.py.
| observables.kxm |
Definition at line 91 of file observables.py.
| observables.ky = np.reshape( np.array( [np.linspace( 0, (yDim/2-1)*dky, yDim/2), np.linspace( (-yDim/2-1)*dky, -dky, yDim/2)]), (yDim,1) ) |
Definition at line 90 of file observables.py.
| observables.kym |
Definition at line 91 of file observables.py.
| float observables.m = 1.4431607e-25 |
Definition at line 97 of file observables.py.
| tuple observables.mass = (c.getfloat('Params','Mass')) |
Definition at line 72 of file observables.py.
| observables.N = int(c.getfloat('Params','atoms')) |
Definition at line 80 of file observables.py.
| observables.num_vort = int(c.getfloat('Params','Num_vort')) |
Definition at line 77 of file observables.py.
| tuple observables.omega = (c.getfloat('Params','omega')) |
Definition at line 73 of file observables.py.
| tuple observables.omegaX = (c.getfloat('Params','omegaX')) |
Definition at line 74 of file observables.py.
| tuple observables.omegaZ = (c.getfloat('Params','omegaZ')) |
Definition at line 71 of file observables.py.
| float observables.PI = 3.141592653589793 |
Definition at line 52 of file observables.py.
| observables.prec |
Definition at line 54 of file observables.py.
| observables.V = np.array(open('V_0').read().splitlines(),dtype='f8') |
Definition at line 225 of file observables.py.
| observables.x = np.asarray(open('x_0').read().splitlines(),dtype='f8') |
Definition at line 84 of file observables.py.
Referenced by latexFig().
| observables.xDim = int(c.getfloat('Params','xDim')) |
Definition at line 58 of file observables.py.
| tuple observables.xMax = (c.getfloat('Params','xMax')) |
Definition at line 69 of file observables.py.
| observables.xPy = np.array(open('xPy_0').read().splitlines(),dtype='f8') |
Definition at line 229 of file observables.py.
| observables.y = np.asarray(open('y_0').read().splitlines(),dtype='f8') |
Definition at line 85 of file observables.py.
Referenced by latexFig().
| observables.yDim = int(c.getfloat('Params','yDim')) |
Definition at line 59 of file observables.py.
| tuple observables.yMax = (c.getfloat('Params','yMax')) |
Definition at line 70 of file observables.py.
| observables.yPx = np.array(open('yPx_0').read().splitlines(),dtype='f8') |
Definition at line 231 of file observables.py.
 1.8.14